- IQ is optimal for online queries
- IQ runs in the NET-TRIO environment for intra/internet solutions
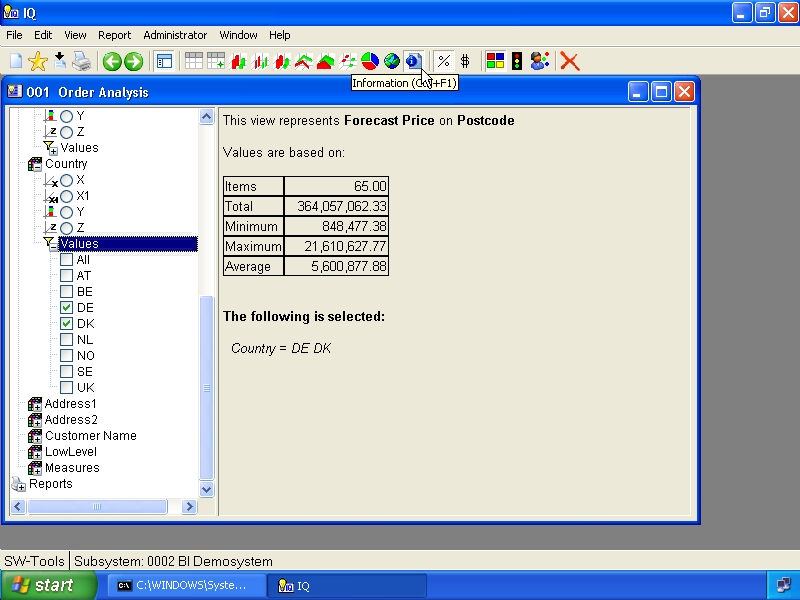
- IQ provides the link back to the real database information for complete drill-down capabilities
http://www.swtools.com
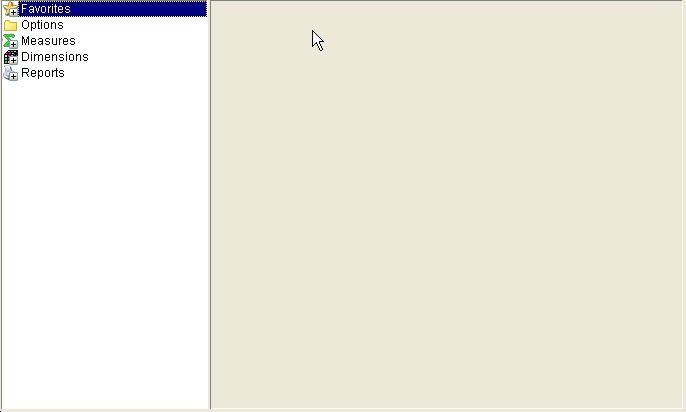
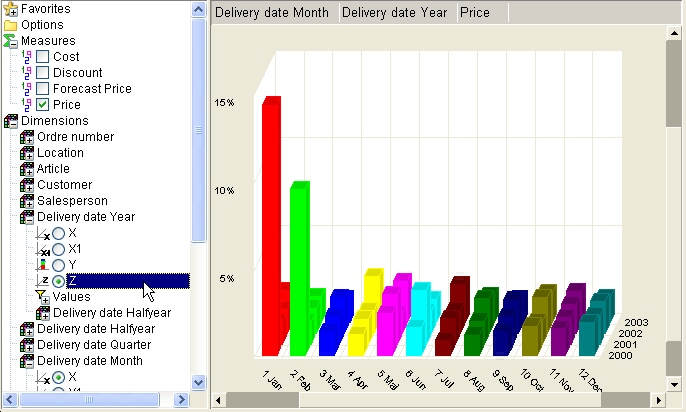
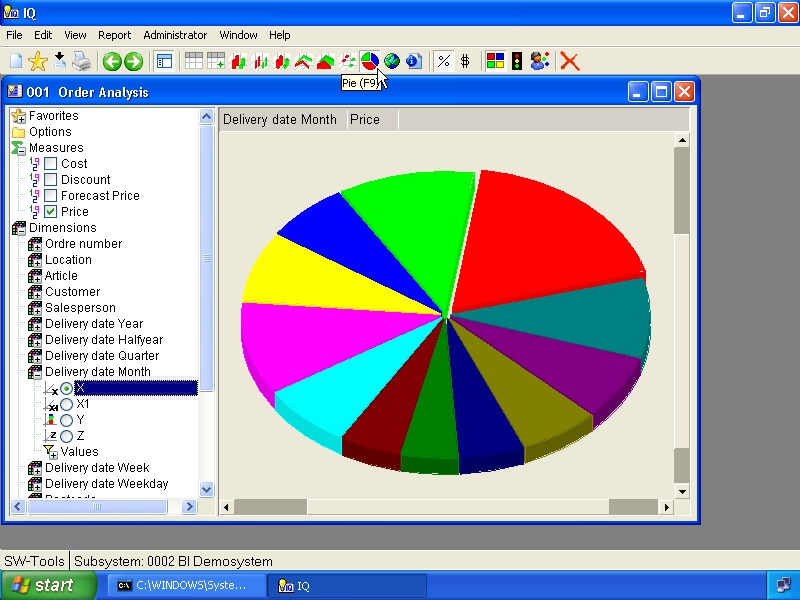
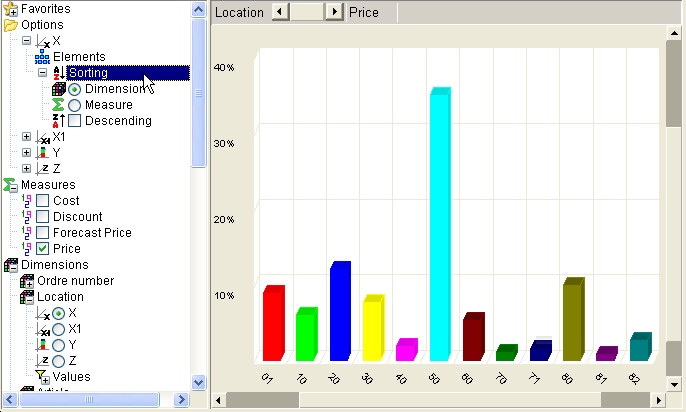
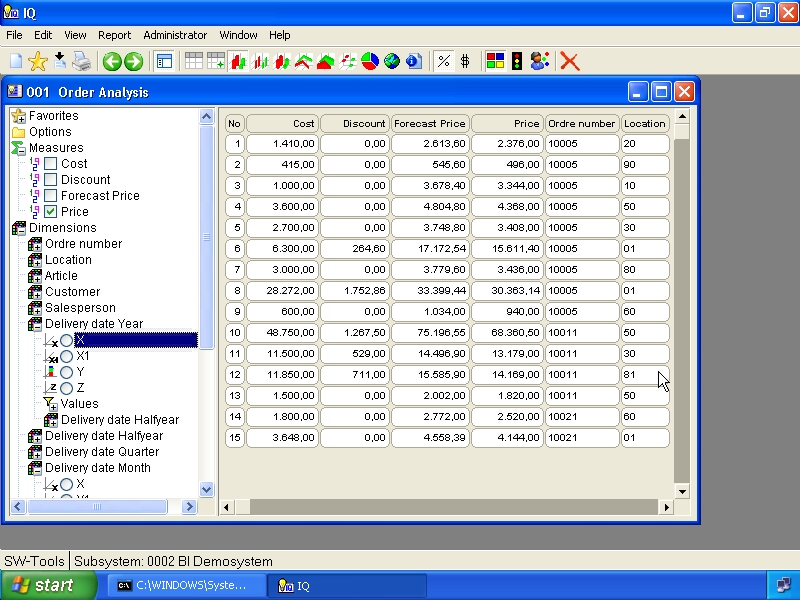
- A controlpanel
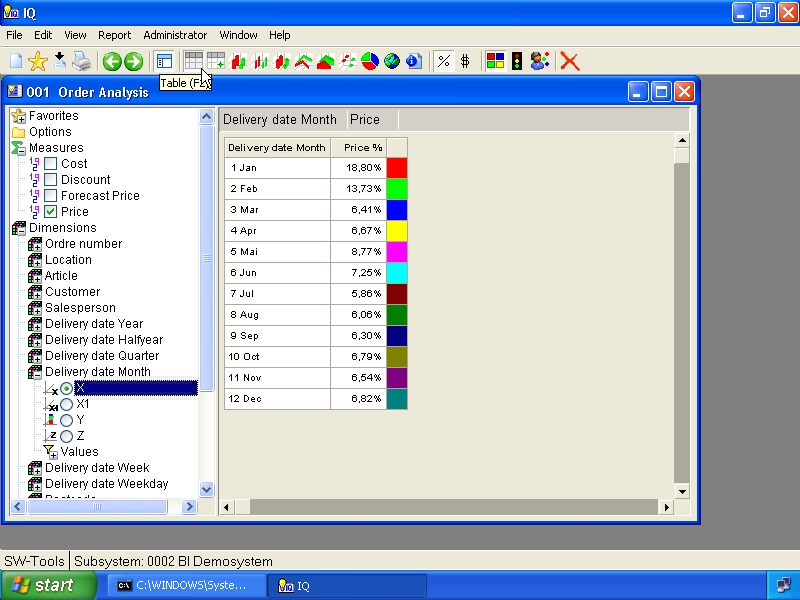
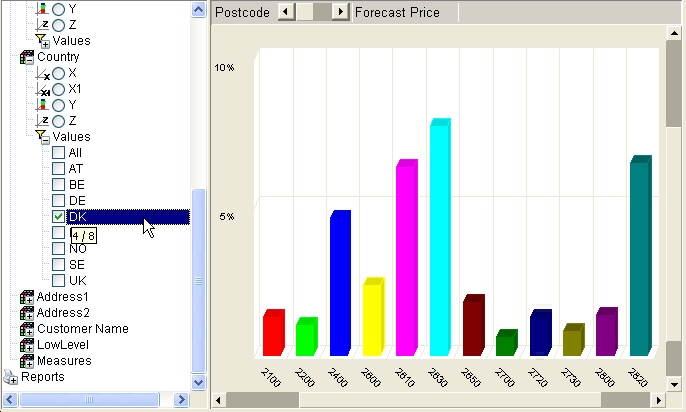
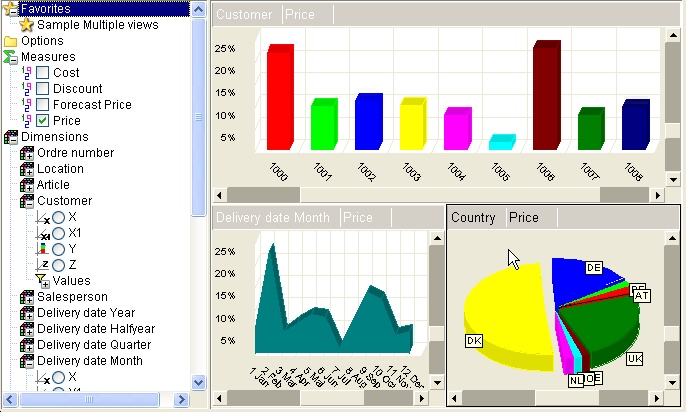
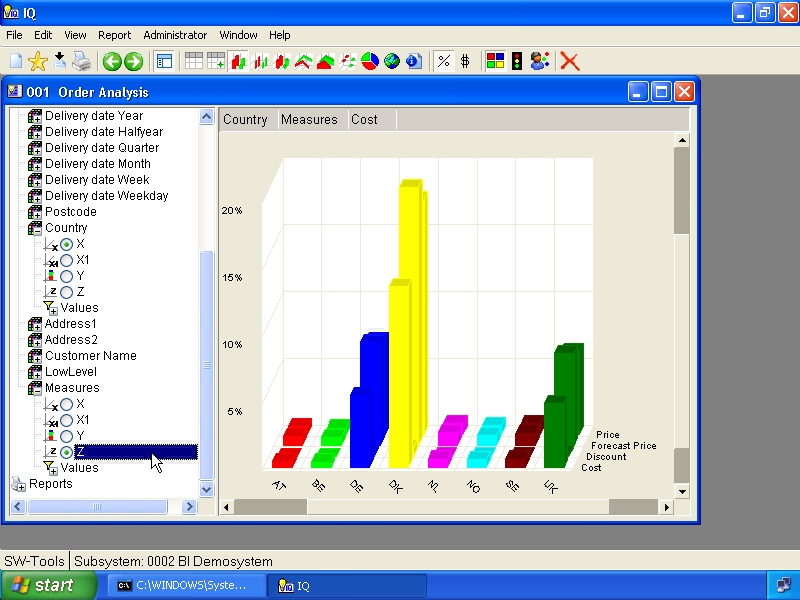
- A view area


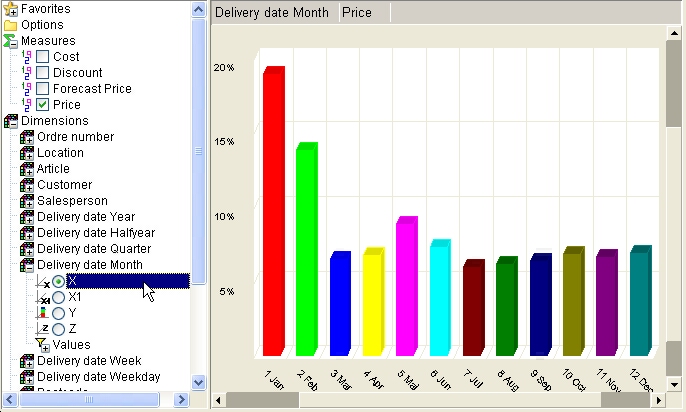

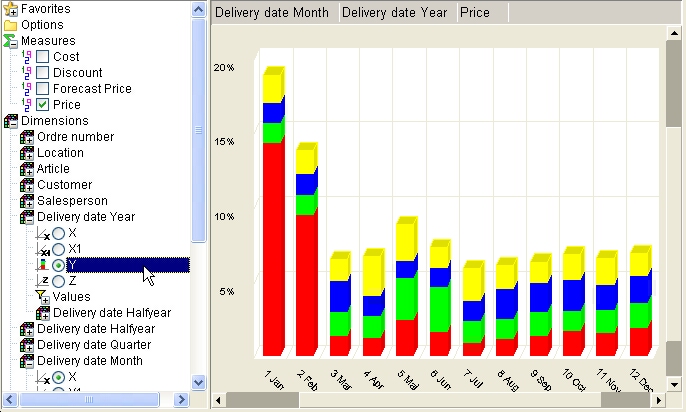


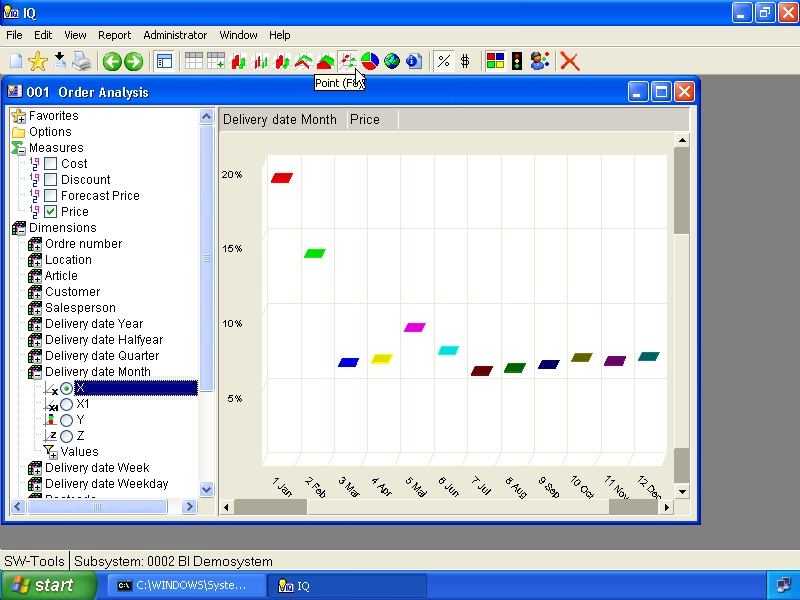
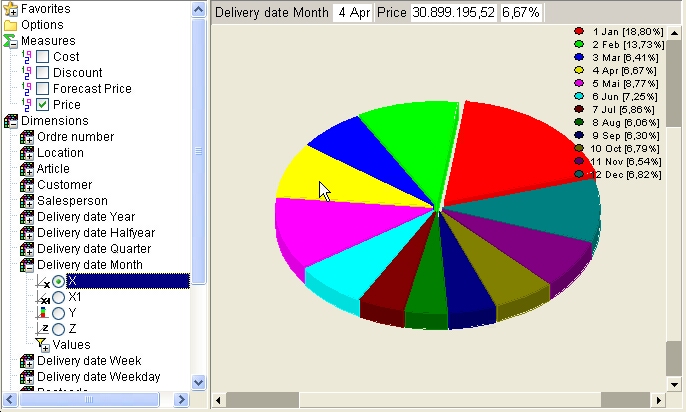
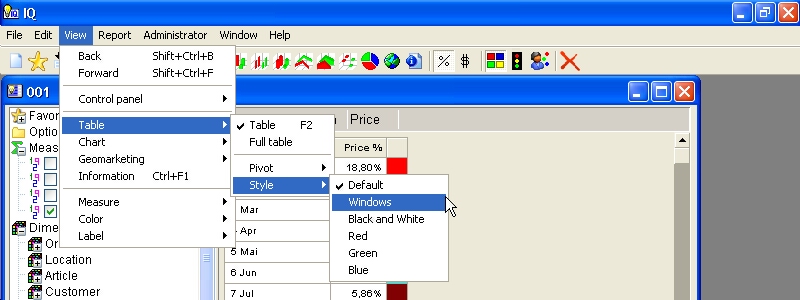
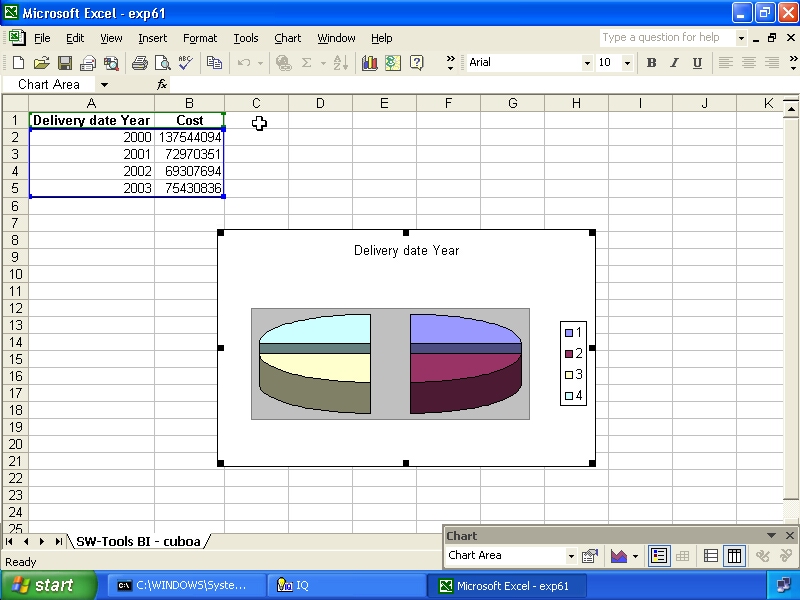
- View, Chart, Legend
- View, Chart, 2D


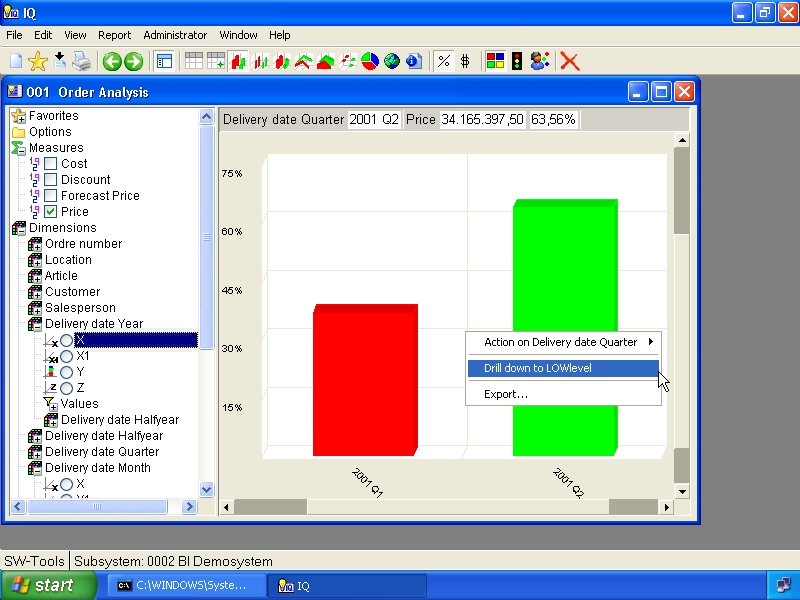
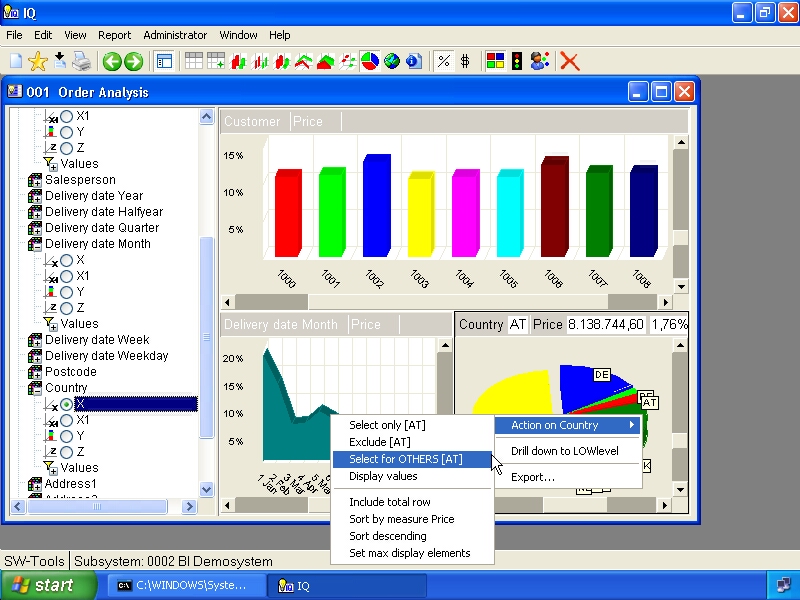
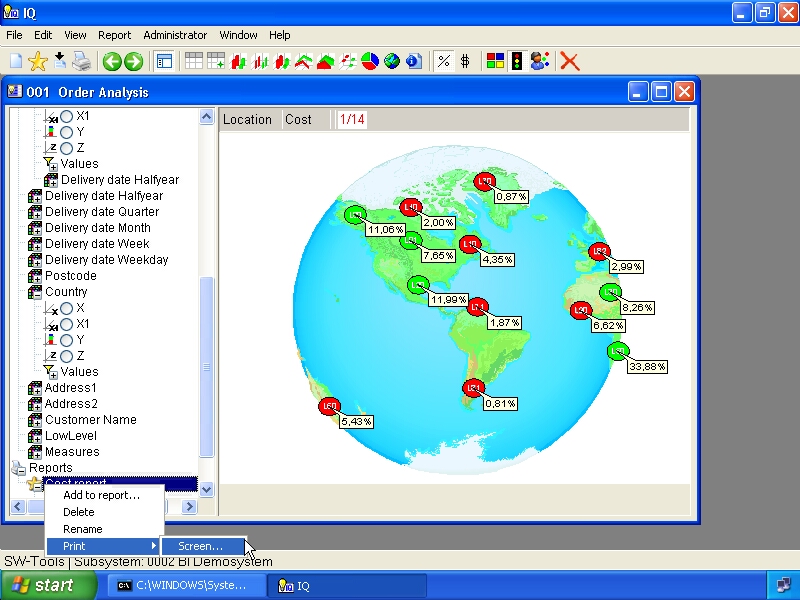
- Red color if the item is below the average value of the entire view
- Yellow color if the item is equal to the average value of the entire view
- Green color if the item is above the average value of the entire view
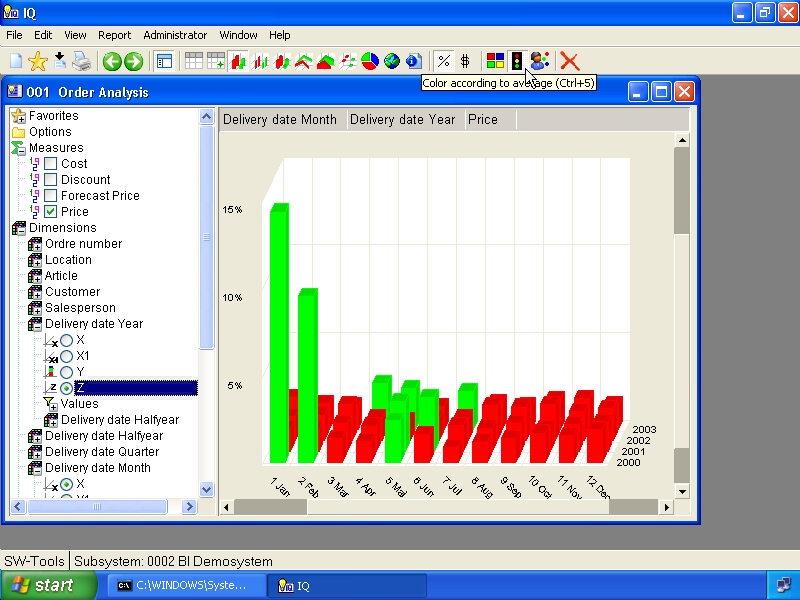
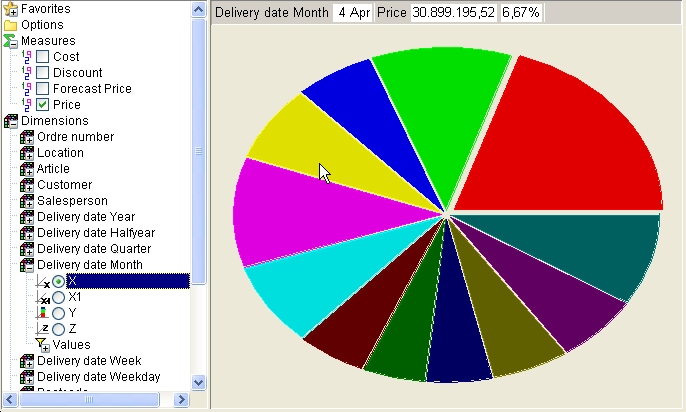
- Percentage of the average value for the view

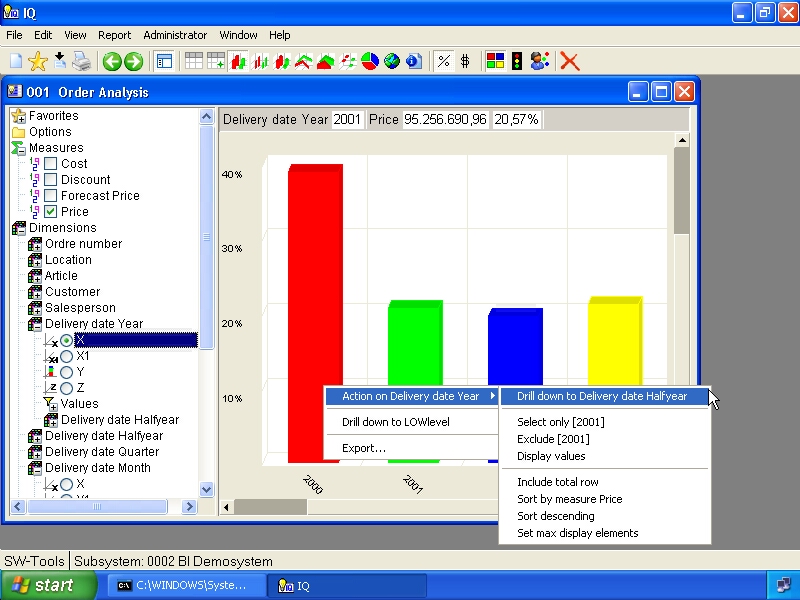
- Selecting the tollbar item Back
- Right click on the item and select menu item Drill-up to ...
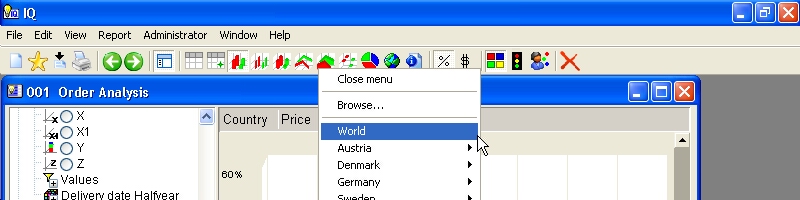
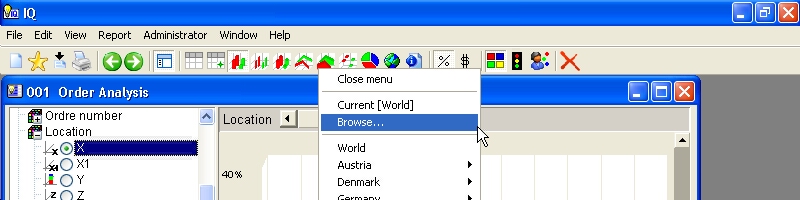
- Country
- State
- City
- Region
- Postalcode

- Austria, Regions
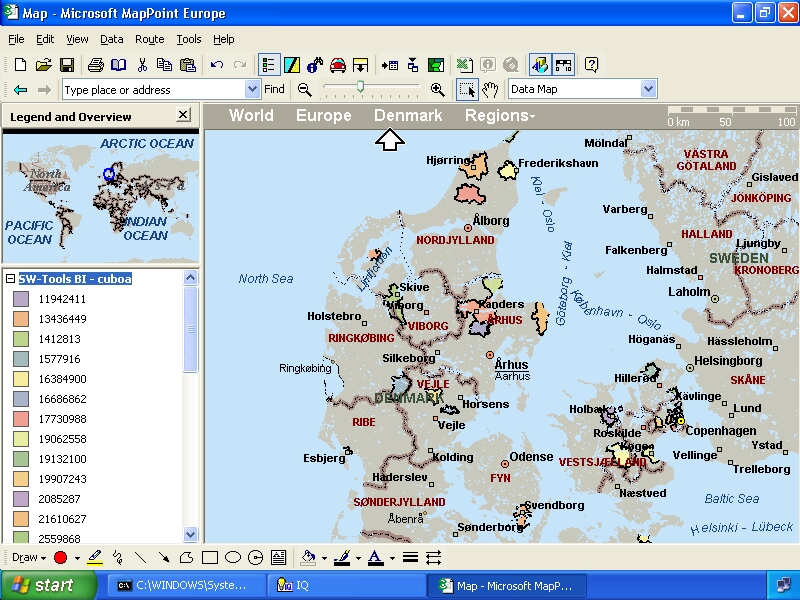
- Denmark, Country, State and Zipcode
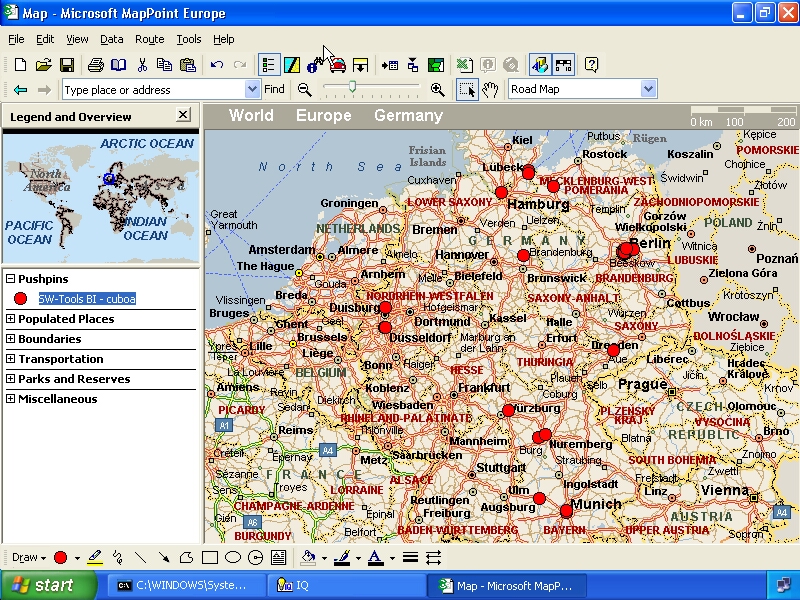
- Germany, Regions, Tow & Country sectors, Zipcode 1 & 2 digit
- Sweden, Regions
- England, Postalcode Area ID
- United States of America, States

- Sales regions
- Stock locations
- Office locations
- Customer areas
- Organizational diagrams
- etc.


c:\swtools\bi\maps2.ppt
- Red may be set to a value from 0 to 255
- Green may be set to a value from 0 to 255
- Blue MUST ALWAYS BE SET TO 1
SWMAP;8;70
{{SWMAPS}}
{{8;70}}
{{9;71�This�is�my�test}}
{{SWMAPE}}
- File, Save as...
c:\swtools\bi\lxx.wmf
Windows Meta File
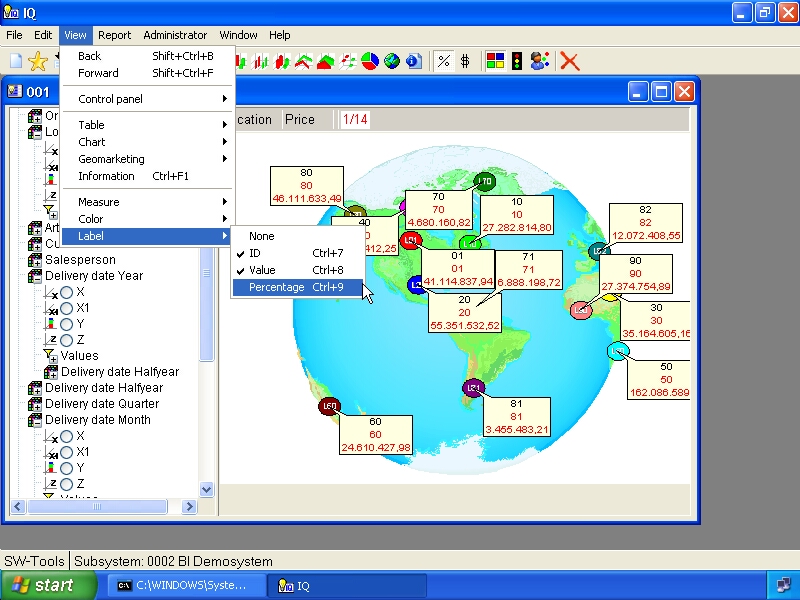
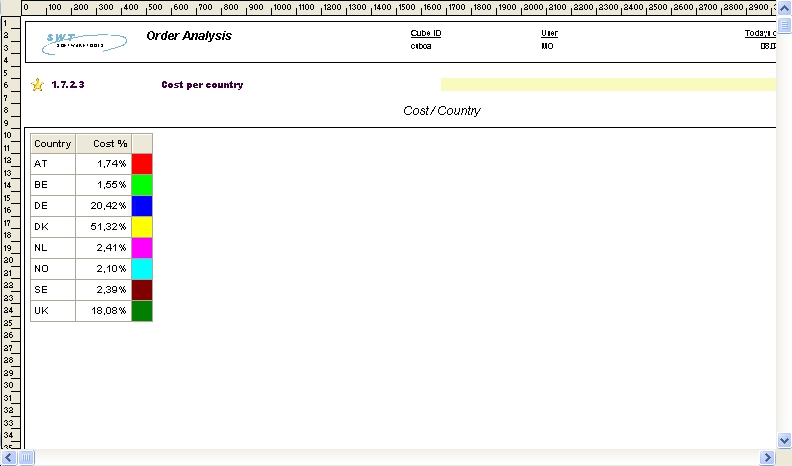
- ID
- Value
- Percentage

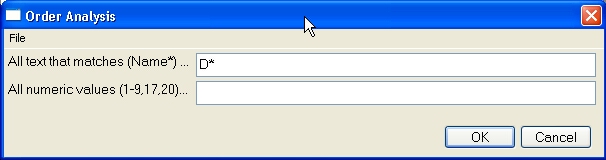
D*
1-7,10-20
(
)
|
&
>=
<=
(A*|B*)&*S
d or t todays date
y or � or j this year
m this month
w or u this week
+1y add one year
-2m subtract 2 months
>=d&<=


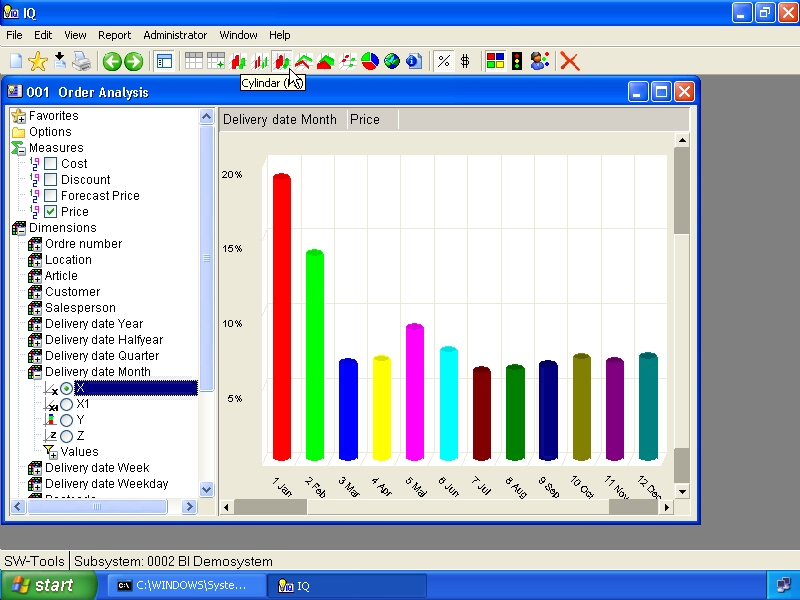
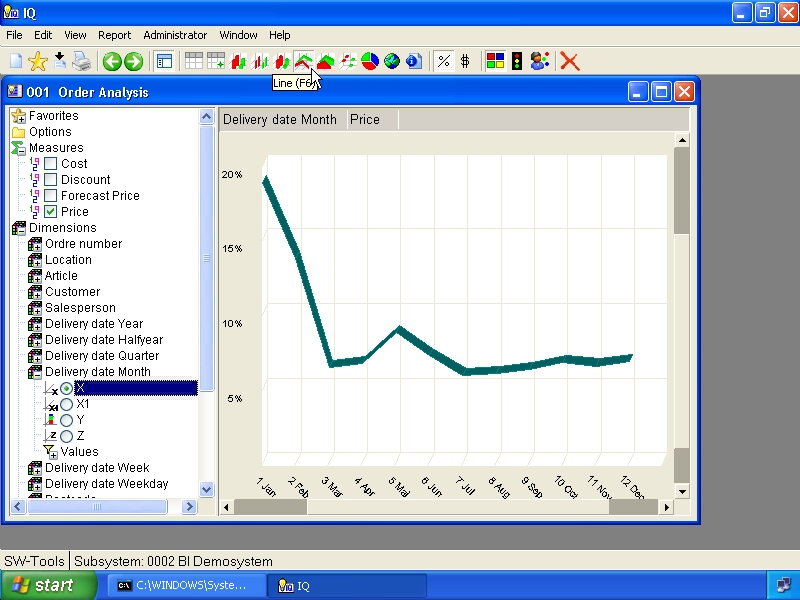
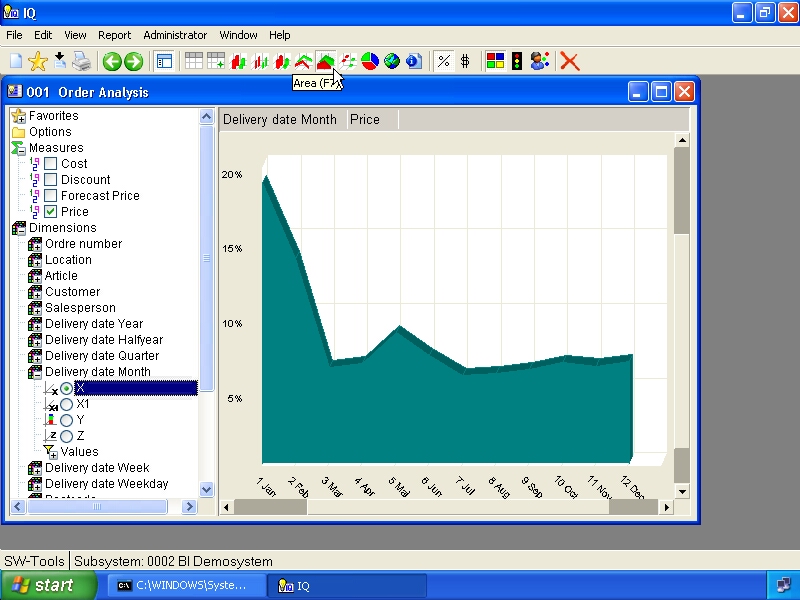
| Key | Description | Delete | Clear all and close all levels in controlpanel | F2 | Table view | F3 | Bar chart view | F4 | Thin bar chart view | F5 | Cylindar chart view | F6 | Line chart view | F7 | Area chart view | F8 | Point chart view | F9 | Pie chart view | F11 | Show/hide controlpanel | F12 | Map selection |
| Key | Description | 0 | Rotate views | 1 | View percentage | 2 | View value | 3 | Include subtotals | 4 | Automatic color | 5 | Color according to average | 6 | Coloraccording to calculation | 7 | Show/hide label id | 8 | Show/hide label value | 9 | Show/hide label percentage | W | New view | S | Add to favorites | P | Hardcopy | C | Duplicate current view | X | Delete current view | F1 | Information view |
| Key | Description | B | Back in history | F | Forward in history | 1 | Pivot table X as column | 2 | Pivot table X1 as column | 3 | Pivot table Y as column | 4 | Pivot table Z as column |
| Key | Description | + | Zoom in | - | Zoom out | * | Zoom all |